A minimal theme with fundraising-report friendly defaults.
Usage
theme_fundr(
  base_family = "montserrat",
  base_size = 12,
  plot_title_family = base_family,
  plot_title_size = 16,
  plot_title_face = "bold",
  plot_title_margin = 10,
  subtitle_family = base_family,
  subtitle_size = 14,
  subtitle_face = "plain",
  subtitle_margin = 15,
  strip_text_family = base_family,
  strip_text_size = 10,
  strip_text_face = "plain",
  caption_family = base_family,
  caption_size = 10,
  caption_face = "italic",
  caption_margin = 10,
  axis_text_size = base_size,
  axis_title_family = subtitle_family,
  axis_title_size = 10,
  axis_title_face = "plain",
  axis_title_just = "rt",
  plot_margin = NULL,
  grid_col = "#cccccc",
  grid = TRUE,
  axis_col = "#cccccc",
  axis = FALSE,
  ticks = FALSE
)
Arguments
- base_family
base font family
- base_size
base font size, given in pts.
- plot_title_family, plot_title_size, plot_title_face
Title font family, size, and face.
- plot_title_margin
Bottom margin (in points) below the plot title.
- subtitle_family, subtitle_size, subtitle_face
Subtitle font family, size, and face.
- subtitle_margin
Bottom margin (in points) below the subtitle.
- strip_text_family, strip_text_size, strip_text_face
Facet strip text font family, size, and face.
- caption_family, caption_size, caption_face
Caption font family, size, and face.
- caption_margin
Top margin (in points) above the caption.
- axis_text_size
Axis tick label text size.
- axis_title_family, axis_title_size, axis_title_face
Axis title font family, size, and face.
- axis_title_just
Two-character code controlling axis title justification; see Details.
- plot_margin
Plot margin; defaults to
ggplot2::margin(30, 30, 30, 30).- grid_col
Color for grid lines.
- grid
Logical; if
TRUEshow major+minor grids. If a character string, controls which grids are shown: includeX/Yfor major x/y andx/yfor minor x/y (e.g.,"XY"or"Xy").- axis_col
Color for axis lines (when enabled).
- axis
Logical; if
TRUEshow both axes. If a character string, controls which axes are shown (e.g.,"x","y","xy").- ticks
Logical; if
TRUEshow axis ticks.
Details
axis_title_just is interpreted as a two-character code, where the first character controls the
x-axis title (l, m/c, r) and the second controls the y-axis title (b, m/c, t).
The default "rt" places the x title right and the y title at the top.
See also
Other theme:
fundr_use_google_font(),
legend_bottom(),
legend_position()
Examples
library(ggplot2)
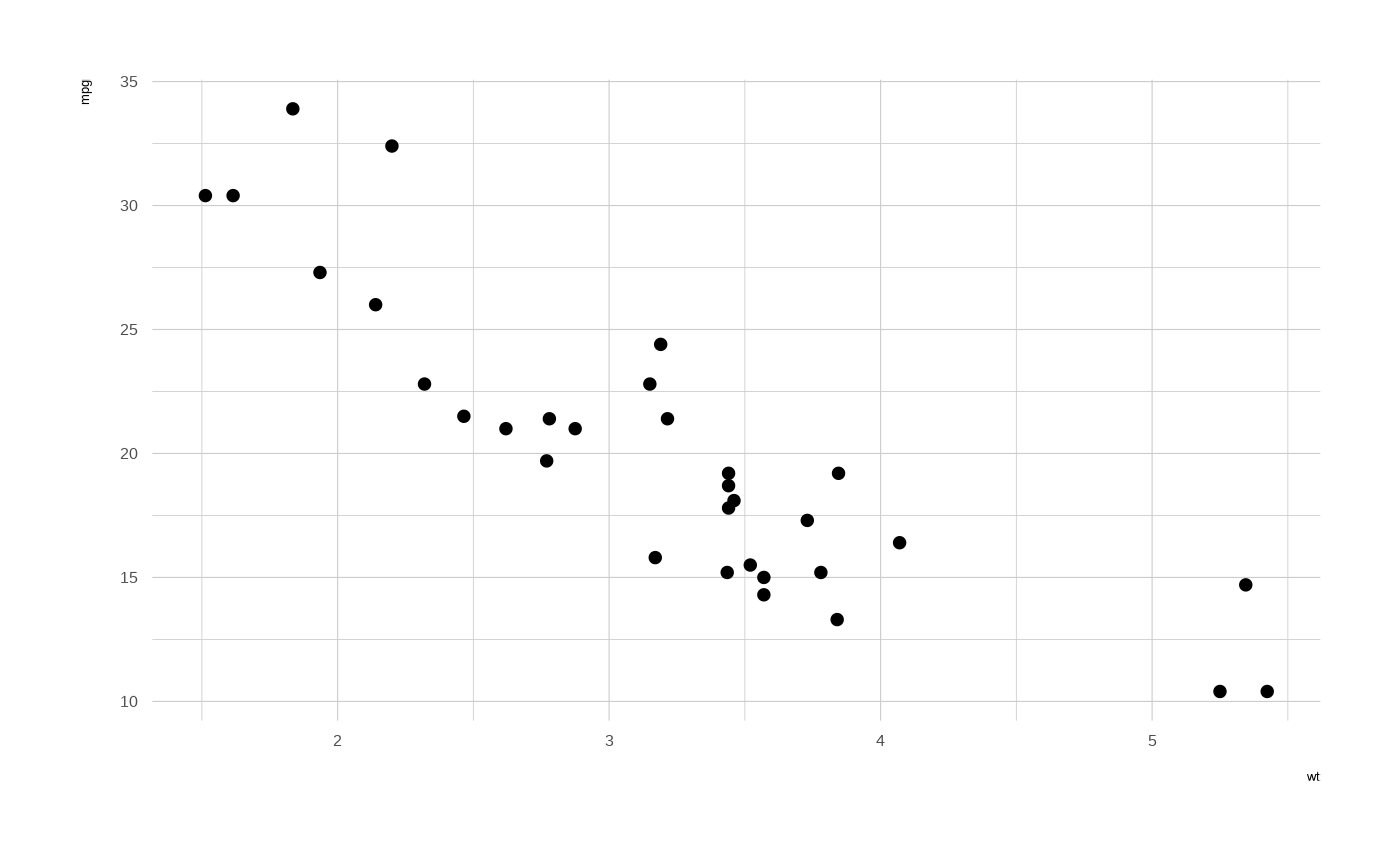
# Basic usage with default settings
ggplot(mtcars, aes(wt, mpg)) +
geom_point() +
theme_fundr(base_family = "sans")
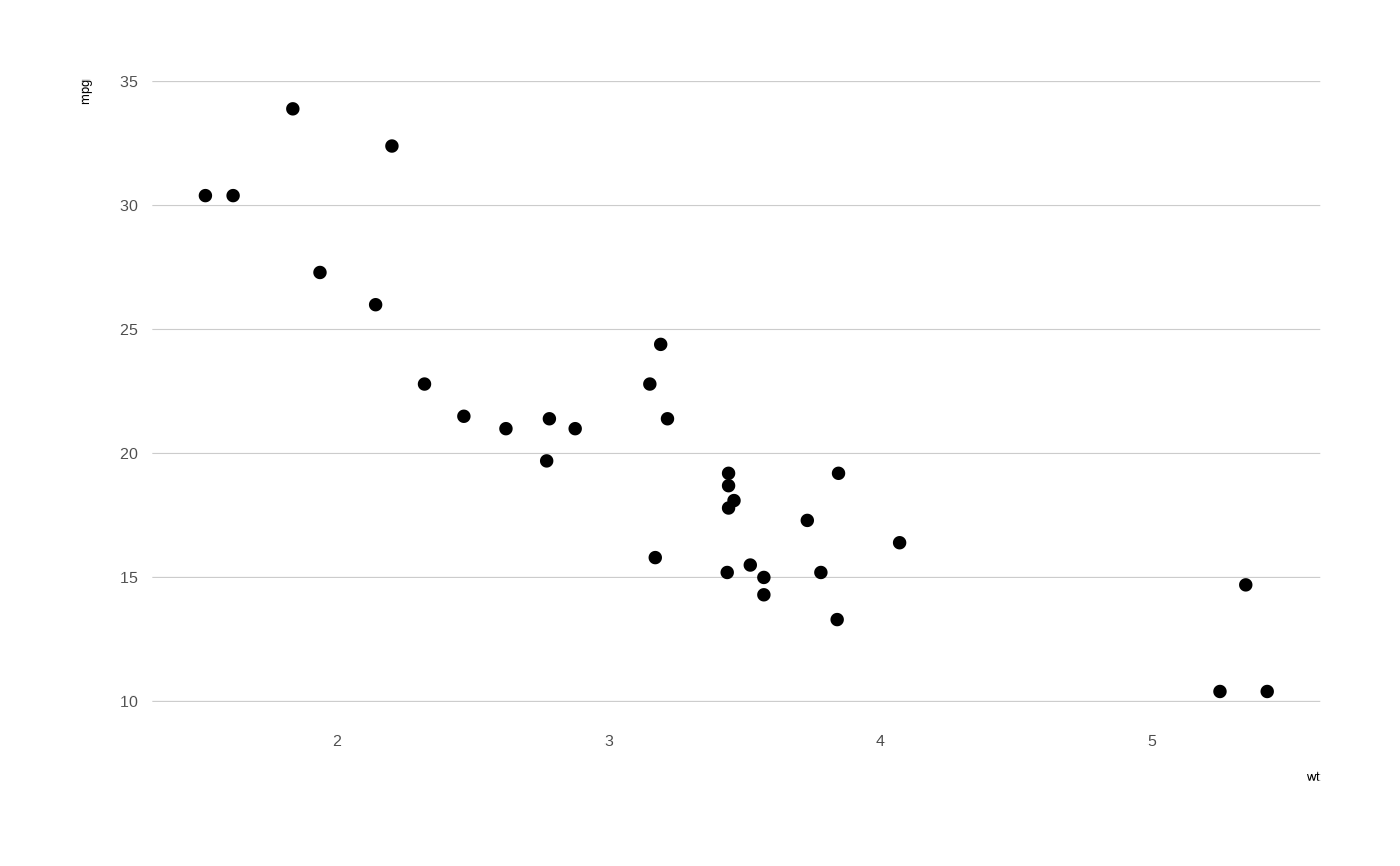
 # Customize grid display
ggplot(mtcars, aes(wt, mpg)) +
geom_point() +
theme_fundr(base_family = "sans", grid = "Y")
# Customize grid display
ggplot(mtcars, aes(wt, mpg)) +
geom_point() +
theme_fundr(base_family = "sans", grid = "Y")