Formats y-axis labels as currency values, avoiding scientific notation and displaying proper dollar formatting. Supports both full format ($1,234,567) and compact format ($1.2M).
Usage
scale_y_currency(
  prefix = "$",
  suffix = "",
  big.mark = ",",
  decimal.mark = ".",
  digits = 0L,
  short = FALSE,
  short_digits = 1L,
  negative = c("minus", "parens"),
  ...
)
Arguments
- prefix
Currency symbol prefix. Default "$".
- suffix
Currency symbol suffix. Default "".
- big.mark
Thousands separator. Default ",".
- decimal.mark
Decimal separator. Default ".".
- digits
Number of decimal places. Default 0.
- short
Logical; if TRUE, use compact notation (K/M/B). Default FALSE.
- short_digits
Decimal places for compact notation. Default 1.
- negative
How to display negative numbers: "parens" or "minus". Default "minus".
- ...
Additional arguments passed to
ggplot2::scale_y_continuous().
Examples
library(ggplot2)
# Sample data with large dollar amounts
df <- data.frame(
category = c("A", "B", "C", "D"),
amount = c(1500000, 2300000, 800000, 3100000)
)
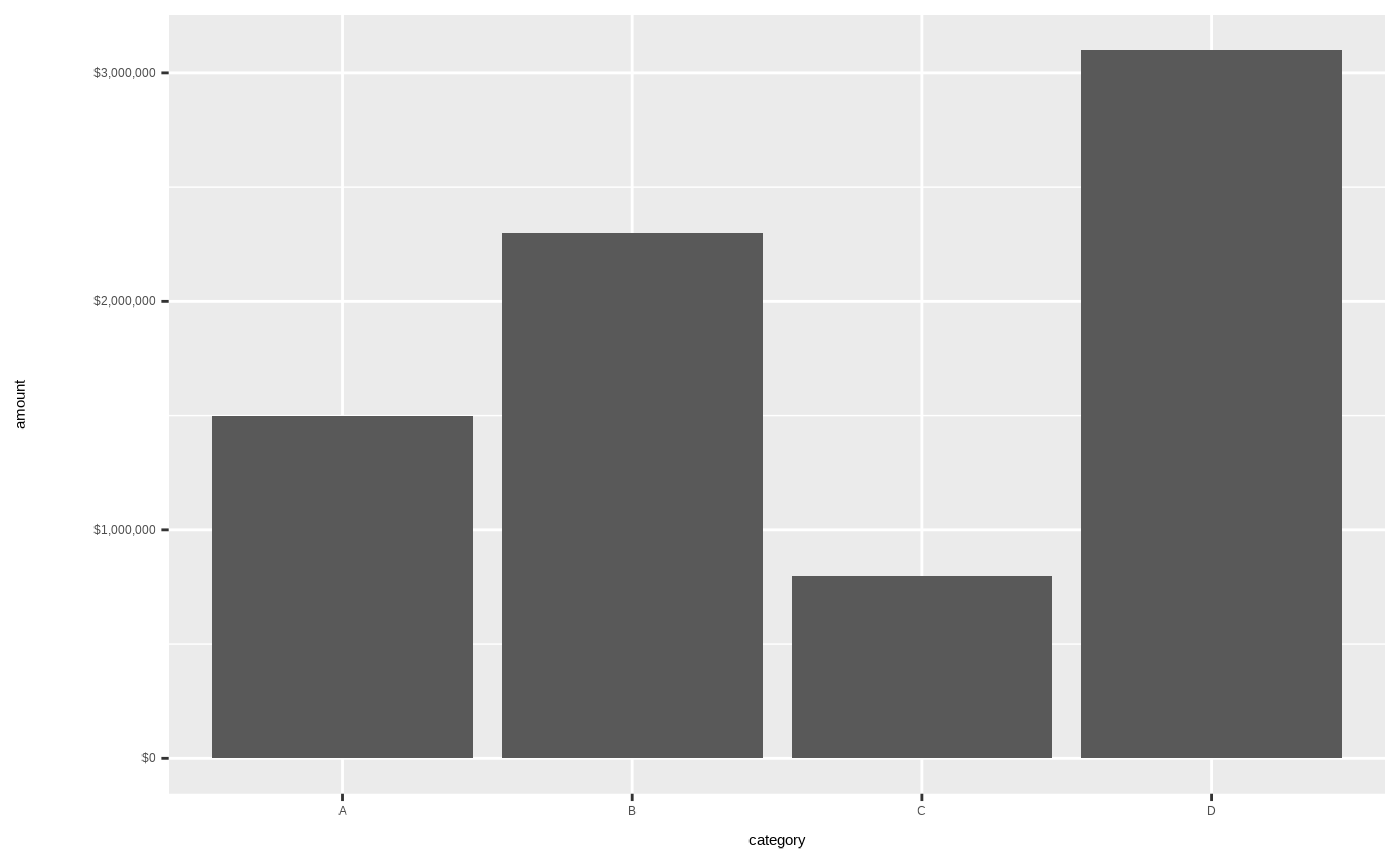
# Default currency formatting
ggplot(df, aes(category, amount)) +
geom_col() +
scale_y_currency()
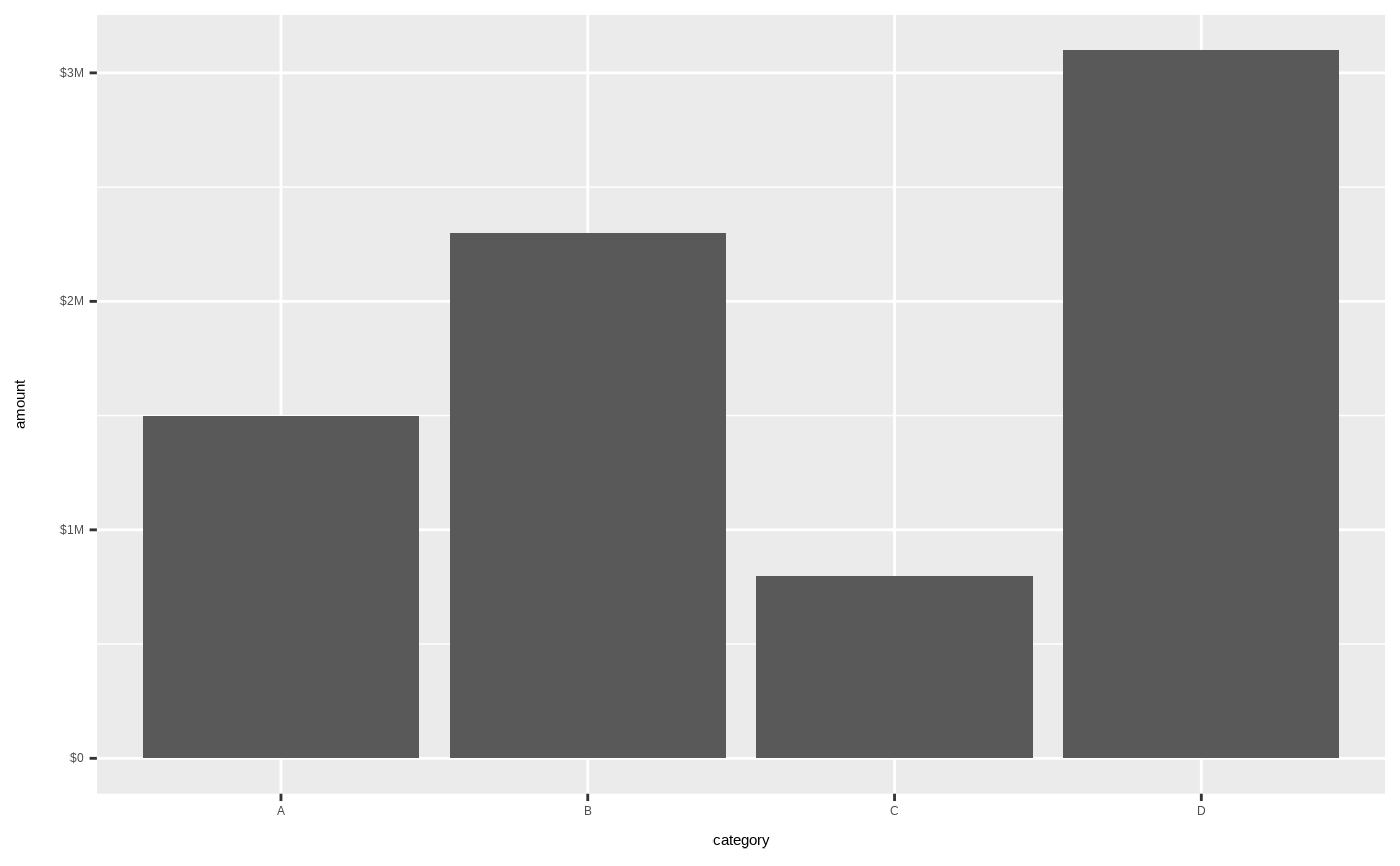
 # Compact notation for large values
ggplot(df, aes(category, amount)) +
geom_col() +
scale_y_currency(short = TRUE)
# Compact notation for large values
ggplot(df, aes(category, amount)) +
geom_col() +
scale_y_currency(short = TRUE)